[Oct 24] The Carbon Footprint of The Internet - Analysing the Carbon Emissions of the World's Most Visited Sites
Quick internet carbon emission stats:
The Internet as a percentage of global greenhouse gas emissions: 3.7%
Average internet emissions by person: 414 kgs of carbon dioxide per year per user
Total kgs of greenhouse gas emissions globally: 1.7 billion tonnes
Source: Climate Impact Partners, 2024
Gary Cook said, "The internet is the single biggest thing we're going to build as a species." in The Environmental Toll of a Netflix Binge. Additionally, nearly 70% of the planet’s population—about 5 billion people—access the internet daily, powering countless digital interactions and driving an ever-growing demand for electricity.
In a recent study focusing on the 500+ biggest global websites, we examined their carbon emissions per user. We collected data on the websites’ yearly views and ran these through a carbon calculator to provide us the exact carbon emissions these websites emit.
Our analysis reveals the significant impact that our online activities have on the environment and highlights areas for improvement among leading companies.
Understanding Emissions Per User
Emissions per user refer to the amount of carbon dioxide (CO2) generated by a website each time a user visits. This metric considers the energy consumed by data centres, networks, and end-user devices. It doesn’t include embodied emissions, such as the production of computer chips. A high emissions per user rate indicates a significant environmental impact, while a low rate suggests a more sustainable operation.
Top 3 Websites with Highest Emissions Per User
We have uncovered that certain websites are major contributors to carbon emissions. Based on the data, the top three websites (based on their actual page views) which emit the amount of emissions that trees do are:
- Pinterest (pinterest.com) - equivalent to the amount of energy 2,589,406 trees absorb…
- Docomo (docomo.ne.jp) - equivalent to 2,861,352 trees
- Office.com (office.com) - equivalent to 2,4249,11 trees
Companies Not Using Sustainable Energy
The transition to sustainable energy is crucial for reducing carbon emissions. Our analysis showed that several websites from the top 50 list do not use sustainable energy sources.
These include:
- Yahoo (yahoo.com)
- Bing (bing.com)
- Reddit (reddit.com)
- Twitter/X (Twitter.com)
This means the energy these companies use to power their servers and data centres is still coming from sources that produce a lot of pollution. As a result, their operations contribute significantly to carbon emissions, which harmfully impact the environment. Transitioning to sustainable energy sources would greatly reduce their carbon footprints and help combat climate change.
But how are well-known worldwide websites doing?
- As a leading video streaming platform,
YouTube’s high emissions per user are concerning. The energy-intensive nature of streaming services highlights the need for significant improvements in energy efficiency and a shift towards renewable energy sources.
Based on yearly pageviews alone, you’d need to boil 413 billion cups of tea to equal the amount of emissions YouTube emits. - Netflix
has a significant carbon footprint due to streaming high-definition content, requiring further efforts to reduce emissions despite renewable energy investments.
174,976 trees absorb the same amount of energy as Netflix users - Facebook
has achieved commendable progress in renewable energy adoption, but there is still room for improvement, primarily due to the high popularity and number of visitors to their website.
1,942,696,201 is the cup of tea equivalent here, so considerably less than Youtube.
| Website | Domain | Popularity Ranking | Type | Country | Carbon Rating | Emissions per User (kg CO2) | Sustainable Energy |
|---|---|---|---|---|---|---|---|
| Google Search | google.com | 1 | Search engine | United States | A | 0.17 | Yes |
| YouTube | youtube.com | 2 | Video-sharing platform | United States | E | 0.79 | Yes |
| facebook.com | 3 | Social network | United States | A+ | 0.07 | Yes | |
| instagram.com | 4 | Social network | United States | D | 0.57 | Yes | |
| twitter.com | 5 | Social network | United States | C | 0.44 | No | |
| Baidu | baidu.com | 6 | Search engine | China | B | 0.22 | No |
| Wikipedia | wikipedia.org | 7 | Reference work | United States | A+ | 0.02 | No |
| Yahoo! | yahoo.com | 8 | Web portal | United States | F | 0.93 | No |
| Yandex Search | yandex.ru | 9 | Search engine | Russia | A+ | 0.07 | No |
| whatsapp.com | 10 | Instant messaging | United States | D | 0.54 | Yes | |
| XVideos | xvideos.com | 11 | Pornography | France | C | 0.46 | No |
| TikTok | tiktok.com | 12 | Social network | China | F | 0.92 | Yes |
| Amazon | amazon.com | 13 | E-commerce | United States | F | 1.01 | Yes |
| reddit.com | 14 | Social network | United States | E | 0.73 | No | |
| Pornhub | pornhub.com | 15 | Pornography | Canada | D | 0.5 | No |
| Yahoo! Japan | yahoo.co.jp | 16 | Web portal | Japan | B | 0.31 | No |
| Docomo | docomo.ne.jp | 17 | Consumer electronics | Japan | F | 2.94 | No |
| Microsoft Outlook | live.com | 18 | Email client | United States | B | 0.23 | Yes |
| XNXX | xnxx.com | 19 | Pornography | France | B | 0.3 | No |
| linkedin.com | 20 | Social network | United States | A | 0.13 | Yes | |
| OpenAI | openai.com | 21 | Artificial intelligence | United States | C | 0.47 | Yes |
| Netflix | netflix.com | 22 | Streaming service | United States | B | 0.2 | Yes |
| Microsoft 365 | office.com | 23 | Productivity software | United States | F | 2.67 | Yes |
| Microsoft Bing | bing.com | 24 | Search engine | United States | B | 0.33 | Yes |
| Zen News | dzen.ru | 25 | News aggregator | Russia | F | 1.13 | No |
| Microsoft Online | microsoftonline.com | 26 | Developer software | United States | Offline | Offline | Offline |
| xxx | xxx.com | 27 | xxx | Cyprus | F | 1.27 | Yes |
| Naver | naver.com | 28 | Web portal | South Korea | F | 1.25 | No |
| pinterest.com | 29 | Social network | United States | F | 3.81 | No | |
| VK | vk.com | 30 | Social network | Russia | D | 0.57 | No |
| Bilibili | bilibili.com | 31 | Video-sharing platform | China | D | 0.55 | No |
| Max | max.com | 32 | Streaming service | United States | E | 0.75 | Yes |
| Samsung Electronics | samsung.com | 33 | Consumer electronics | South Korea | D | 0.53 | No |
| Mail.ru | mail.ru | 34 | Email client | Russia | F | 4 | No |
| Discord | discord.com | 35 | Instant messaging | United States | E | 0.7 | Yes |
| Microsoft | microsoft.com | 36 | Technology | United States | B | 0.23 | Yes |
| Turbo Pages | turbopages.org | 37 | Developer software | Russia | A+ | 0.05 | No |
| Twitch | twitch.tv | 38 | Social network | United States | F | 1.37 | No |
| xxx.desi | xxx.desi | 39 | xxx | Germany | F | 1.06 | Yes |
| The Weather Channel | weather.com | 40 | Weather forecasting | United States | A+ | 0.04 | Yes |
| Quora | quora.com | 41 | Social network | United States | C | 0.47 | Yes |
| Telegram | t.me | 42 | Instant messaging | Russia | D | 0.53 | No |
| DuckDuckGo | duckduckgo.com | 43 | Search engine | United States | D | 0.63 | Yes |
| SharePoint | sharepoint.com | 44 | Productivity software | United States | F | 0.86 | Yes |
| Zoom | zoom.us | 45 | Videoconferencing platform | United States | F | 2.03 | No |
| Stripchat | stripchat.com | 46 | Adult | Cyprus | E | 0.88 | Yes |
| eBay | ebay.com | 47 | E-commerce | United States | E | 0.66 | Yes |
| Globo.com | globo.com | 48 | Web portal | Brazil | F | 1.52 | Yes |
| qq.com | 49 | Web portal | China | A | 0.1 | Yes | |
| Fandom | fandom.com | 50 | Reference work | United States | F | 1.06 | Yes |
Making Sense of the Numbers: Emissions Per User
Understanding the Impact
To illustrate the impact of emissions per user, let’s break down what it means in more relatable terms. Suppose you go on one website per year, the energy needed to ‘fund’ that visit, combined with the millions of other visitors, make it astronomical. This changes for each website - the more sustainable the practice, the lower the emissions.
This comparison highlights the significant environmental cost of seemingly mundane online activities. While planting trees is a helpful way to offset emissions, the ultimate solution lies in reducing the carbon footprint of digital services through sustainable practices and renewable energy.
Website Trees Data Table
| Website URL | Trees per 10k | Actual Trees | Tea Cups |
|---|---|---|---|
| docomo.ne.jp | 5 | 13,866,577 | 41,336,677,530 |
| pinterest.com | 16 | 2,861,352 | 8,529,773,146 |
| vk.com | 21 | 2,589,406 | 7,719,093,872 |
| youtube.com | 4 | 2,427,727 | 7,237,125,981 |
| instagram.com | 15 | 2,424,911 | 7,228,731,881 |
| office.com | 6 | 1,718,693 | 5,123,473,565 |
| yahoo.com | 5 | 1,578,928 | 4,706,831,226 |
| yandex.ru | 3 | 1,452,799 | 4,330,835,292 |
| twitter.com | 5 | 1,252,082 | 3,732,490,850 |
| amazon.com | 3 | 1,149,687 | 3,427,249,687 |
What’s the Harm of Scrolling on Socials?
Scrolling through social media might seem like a harmless way to pass the time, but it has a surprisingly significant impact on the environment. Every time you refresh your feed, watch a video, or like a post, data is transmitted through servers that consume a large amount of energy.
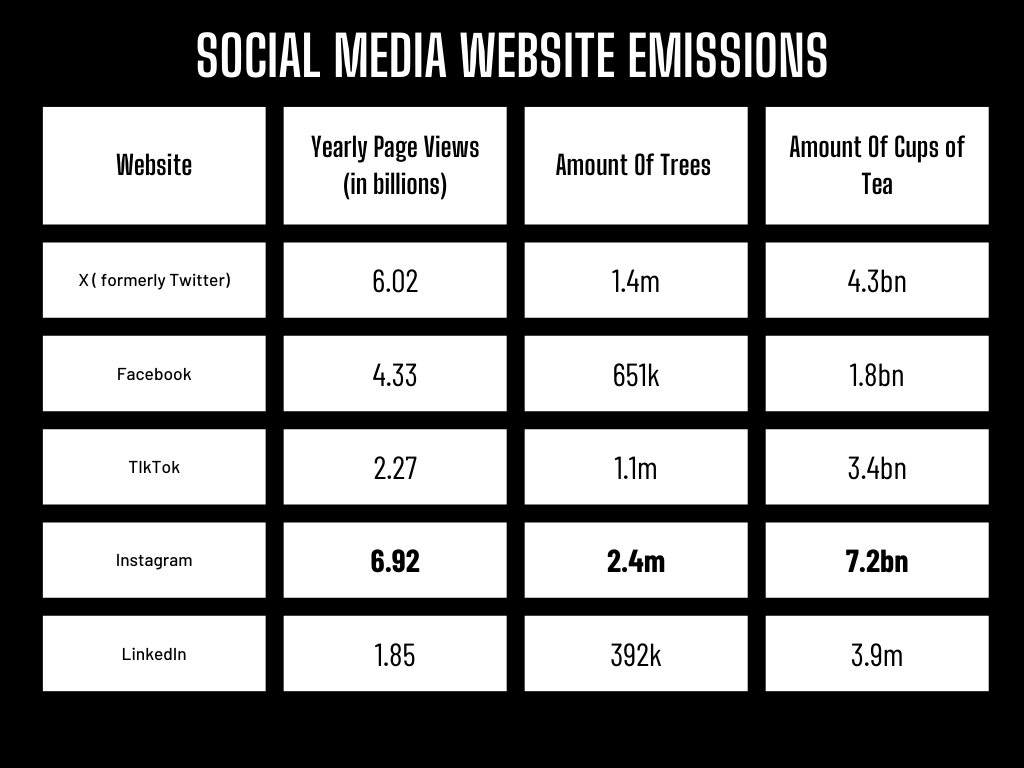
For instance, platforms like YouTube and Twitter are particularly energy-intensive.
YouTube alone requires the energy equivalent of boiling 413 billion cups of tea annually
to support its massive user base and data demands.
Similarly, Twitter needs 5 trees per 10,000 page views to offset its carbon footprint, highlighting the substantial emissions generated by the platform's operations.
The combined emissions from these popular social media platforms contribute significantly to global carbon output. Instagram, another widely used platform, needs 15 trees per 10,000 page views to neutralise its carbon emissions. Even LinkedIn, essential for professional networking, requires 3 trees per 10,000 page views.
When you analyse the total combined emissions from YouTube, Twitter, Instagram, and LinkedIn, the environmental impact becomes staggering. The energy required to support these platforms' data processing and transmission is equivalent to planting nearly 30 million trees yearly. This level of energy consumption and carbon emission is not just a minor issue—it's a wake-up call.
Our daily scrolls and clicks contribute to a massive carbon footprint rivalling the emissions of entire industries. Tech giants and users must recognise this impact and take urgent steps to adopt more sustainable digital practices.
Charles Howes, CEO of Klatch
"Social media platforms play a pivotal role in our daily lives, connecting billions globally. However, with great power comes great responsibility. The data shows that the environmental impact of these platforms is substantial.
At Klatch, we believe every social media company must invest in sustainable practices, enhance energy efficiency, and support global reforestation efforts.
The future of our planet depends on our actions today. By reducing their carbon footprints, social media platforms can create a more sustainable and eco-friendly digital landscape."
The High Environmental Cost: A Nasdaq Comparison
The environmental impact of social media and digital platforms is increasingly being scrutinised, and some of the most popular Nasdaq-listed companies are among the highest contributors to carbon emissions. Leading the list is Instagram, which requires a whopping 15 trees per 10,000 page views to offset its carbon footprint.
This high figure reflects Instagram’s vast user base and the intensive data processing required to deliver its visually rich content. Office.com and TikTok follow closely, both necessitating 6 trees per 10,000 page views.
These platforms, widely used for business productivity and entertainment, respectively, highlight the broad spectrum of digital services contributing to significant environmental costs.
Completing the top five are Reddit and Dzen.ru, each requiring 7 trees per 10,000 page views. Reddit’s extensive network of user-generated content and Dzen.ru’s vast multimedia offerings contribute to their substantial carbon footprints.
Company Data Table
| Company | Ticker | Website | Carbon Rating | Emissions Per User (kg CO2) | Sustainable Energy? |
|---|---|---|---|---|---|
| Adobe Inc. | ADBE | https://www.adobe.com/ | A | 0.18 | Yes |
| ADP | ADP | https://www.adp.com/ | B | 0.48 | Yes |
| Advanced Micro Devices Inc. | AMD | https://www.amd.com/ | |||
| Airbnb | ABNB | https://www.airbnb.com/ | E | 0.74 | Yes |
| Alphabet Inc. (Class A) | GOOGL | https://abc.xyz/ | A | 0.12 | Yes |
| Alphabet Inc. (Class C) | GOOG | https://abc.xyz/ | A | 0.12 | Yes |
| Amazon | AMZN | https://www.amazon.com/ | F | 1.01 | Yes |
| American Electric Power | AEP | http://aep.com/ | F | 0.93 | No |
| Amgen | AMGN | https://www.amgen.com/ | C | 0.45 | No |
| Analog Devices | ADI | https://www.analog.com/en/index.html | E | 0.68 | Yes |
| Ansys | ANSS | https://www.ansys.com/ | D | 0.52 | Yes |
| Apple Inc. | AAPL | https://www.apple.com/ | F | 2.14 | No |
| Applied Materials | AMAT | https://www.appliedmaterials.com/ | C | 0.37 | Yes |
| ASML Holding | ASML | https://www.asml.com/en | C | 0.4 | Yes |
| AstraZeneca | AZN | https://www.astrazeneca.com/ | C | 0.37 | No |
| Atlassian | TEAM | https://www.atlassian.com/ | F | 2.04 | No |
| Autodesk | ADSK | https://www.autodesk.com/ | F | 0.95 | Yes |
| Baker Hughes | BKR | https://www.bakerhughes.com/ | C | 0.47 | No |
| Biogen | BIIB | https://www.biogen.com/ | D | 0.59 | Yes |
| Booking Holdings | BKNG | https://www.bookingholdings.com/ | B | 0.29 | Yes |
| Broadcom Inc. | AVGO | https://www.broadcom.com/ | D | 0.64 | Yes |
| Cadence Design Systems | CDNS | https://www.cadence.com/ | F | 1.39 | Yes |
| CDW Corporation | CDW | https://www.cdw.com/ | E | 0.73 | Yes |
| Charter Communications | CHTR | https://corporate.charter.com/ | E | 0.7 | No |
| Cintas | CTAS | https://www.cintas.com/ | F | 1.01 | Yes |
| Cisco | CSCO | https://www.cisco.com/ | D | 0.56 | Yes |
| Coca-Cola Europacific Partners | CCEP | https://www.cocacolaep.com/ | F | 1.05 | Yes |
| Cognizant | CTSH | https://www.cognizant.com/ | F | 1 | Yes |
| Comcast | CMCSA | https://corporate.comcast.com/ | F | 7.69 | Yes |
| Constellation Energy | CEG | https://www.constellationenergy.com/ | B | 0.31 | Yes |
| Copart | CPRT | https://www.copart.com/ | E | 0.7 | No |
| CoStar Group | CSGP | https://www.costargroup.com/ | E | 0.69 | Yes |
| Costco | COST | https://www.costco.com/ | F | 2.97 | Yes |
| CrowdStrike | CRWD | https://www.crowdstrike.com/ | F | 8.57 | Yes |
| CSX Corporation | CSX | https://www.csx.com/ | F | 1.42 | No |
| Datadog | DDOG | https://www.datadoghq.com/ | E | 0.83 | No |
| DexCom | DXCM | https://www.dexcom.com/ | D | 0.5 | Yes |
| Diamondback Energy | FANG | https://www.diamondbackenergy.com/ | F | 1.97 | No |
| Dollar Tree | DLTR | https://www.dollartree.com/ | F | 1.87 | Yes |
| DoorDash | DASH | https://www.doordash.com/ | F | 1.47 | Yes |
| Electronic Arts | EA | https://www.ea.com/ | F | 0.99 | Yes |
| Exelon | EXC | https://www.exeloncorp.com/ | F | 0.92 | Yes |
| Fastenal | FAST | https://www.fastenal.com/ | C | 0.45 | Yes |
| Fortinet | FTNT | https://www.fortinet.com/ | E | 0.68 | Yes |
| GE HealthCare | GEHC | https://www.gehealthcare.com/ | C | 0.48 | Yes |
| Gilead Sciences | GILD | https://www.gilead.com/ | F | 1.3 | Yes |
| GlobalFoundries | GFS | https://gf.com/ | E | 0.66 | No |
| Honeywell | HON | https://www.honeywell.com/ | E | 0.66 | Yes |
| Idexx Laboratories | IDXX | https://www.idexx.com/en/ | F | 1.25 | No |
| Illumina, Inc. | ILMN | https://www.illumina.com/ | F | 3.61 | Yes |
| Intel | INTC | https://www.intel.com/ | D | 0.53 | Yes |
| Intuit | INTU | https://www.intuit.com/ | D | 0.61 | Yes |
| Intuitive Surgical | ISRG | https://www.intuitive.com/en-us | F | 0.88 | No |
| Keurig Dr Pepper | KDP | https://www.keurigdrpepper.com/ | F | 1.32 | Yes |
| KLA Corporation | KLAC | https://www.kla.com/ | E | 0.76 | Yes |
| Kraft Heinz | KHC | https://www.kraftheinzcompany.com/ | C | 0.47 | Yes |
| Lam Research | LRCX | https://www.lamresearch.com/ | F | 2.59 | Yes |
| Linde plc | LIN | https://www.linde.com/ | F | 0.97 | Yes |
| Lululemon | LULU | https://shop.lululemon.com/ | F | 1.04 | Yes |
| Marriott International | MAR | https://www.marriott.com/ | F | 1.11 | Yes |
| Marvell Technology | MRVL | https://www.marvell.com/ | F | 2.51 | Yes |
| MercadoLibre | MELI | https://mercadolibre.com/ | A+ | 0.03 | No |
| Meta Platforms | META | https://about.meta.com/ | F | 2.09 | Yes |
| Microchip Technology | MCHP | https://www.microchip.com/ | E | 0.75 | Yes |
| Micron Technology | MU | https://www.micron.com/ | F | 2.42 | Yes |
| Microsoft | MSFT | https://www.microsoft.com/ | B | 0.23 | Yes |
| Moderna | MRNA | https://www.modernatx.com/ | F | 0.93 | No |
| Mondelēz International | MDLZ | https://www.mondelezinternational.com/ | F | 1.18 | Yes |
| MongoDB Inc. | MDB | https://www.mongodb.com/ | |||
| Monster Beverage | MNST | https://www.monsterbevcorp.com/ | A | 0.11 | Yes |
| Netflix | NFLX | https://ir.netflix.net/ | B | 0.3 | Yes |
| Nvidia | NVDA | https://www.nvidia.com/ | C | 0.44 | Yes |
| NXP | NXPI | https://www.nxp.com/ | E | 0.74 | No |
| O'Reilly Automotive | ORLY | https://www.oreillyauto.com/ | F | 1.16 | Yes |
| Old Dominion Freight Line | ODFL | https://www.odfl.com/ | F | 1.24 | Yes |
| Onsemi | ON | https://www.onsemi.com/ | E | 0.79 | Yes |
| Paccar | PCAR | https://paccar.com/ | E | 0.75 | No |
| Palo Alto Networks | PANW | https://www.paloaltonetworks.com/ | B | 0.22 | Yes |
| Paychex | PAYX | https://www.paychex.com/ | F | 1.17 | No |
| PayPal | PYPL | https://www.paypal.com/ | E | 0.75 | No |
| PDD Holdings | PDD | https://www.pinduoduo.com/ | F | 1.43 | No |
| PepsiCo | PEP | https://www.pepsico.com/ | F | 2.78 | No |
| Qualcomm | QCOM | https://www.qualcomm.com/ | E | 0.8 | Yes |
| Regeneron | REGN | https://www.regeneron.com/ | F | 2.36 | Yes |
| Roper Technologies | ROP | https://www.ropertech.com/ | E | 0.76 | Yes |
| Ross Stores | ROST | https://www.rossstores.com/ | D | 0.51 | No |
| Sirius XM | SIRI | https://www.siriusxm.com/ | F | 1.51 | Yes |
| Starbucks | SBUX | https://www.starbucks.com/ | C | 0.39 | Yes |
| Synopsys | SNPS | https://www.synopsys.com/ | D | 0.61 | No |
| T-Mobile US | TMUS | https://www.t-mobile.com/ | C | 0.39 | No |
| Take-Two Interactive | TTWO | https://www.take2games.com/ | C | 0.45 | Yes |
| Tesla, Inc. | TSLA | https://www.tesla.com/ | F | 4.68 | No |
| Texas Instruments | TXN | https://www.ti.com/ | C | 0.38 | No |
| The Trade Desk | TTD | https://www.thetradedesk.com/ | E | 0.82 | Yes |
| Verisk | VRSK | https://www.verisk.com/ | D | 0.51 | No |
| Vertex Pharmaceuticals | VRTX | https://www.vrtx.com/ | F | 1.65 | No |
| Walgreens Boots Alliance | WBA | https://www.walgreensbootsalliance.com/ | D | 0.6 | Yes |
| Warner Bros. Discovery | WBD | https://wbd.com/ | F | 11.22 | Yes |
| Workday, Inc. | WDAY | https://www.workday.com/ | F | 0.92 | No |
| Xcel Energy | XEL | https://my.xcelenergy.com/ | E | 0.71 | Yes |
| Zscaler | ZS | https://www.zscaler.com/ | B | 0.34 | Yes |
Our Daily Business Tools
The digital tools and platforms we use extensively in business are essential for daily operations, but they also come with significant environmental costs. We’ve highlighted 5 of the key players based on the overall list.
- Zoom.us - 8 trees per 10k page views
- Office.com - 6 trees per 10k page views
- Live.com - 5 trees per 10k page views
- LinkedIn.com - 3 trees per 10k page views
- Microsoft.com - 3 trees per 10k page views
Zoom - A High Environmental Cost for Connectivity
Zoom tops the list with a requirement of 8 trees per 10,000 page views. The platform's widespread use for video conferencing and remote meetings, especially since the onset of the COVID-19 pandemic, has dramatically increased its data transmission needs. This has, in turn, escalated its carbon footprint, highlighting the significant environmental impact of maintaining global connectivity in the business world.
Office - Productivity with Environmental Considerations
Microsoft Office is integral to business productivity with tools like Word, Excel, and PowerPoint, and needs 6 trees per 10,000 page views. The extensive use of these tools in daily business operations contributes to significant data processing and storage requirements, leading to a considerable environmental impact.
Live.com - Essential Communications
Live.com, a crucial platform for email and online services, requires 5 trees per 10,000 page views. Its continuous data processing demands underscore the impact of maintaining essential business communication tools. As a primary service for many enterprises, reducing Live’s carbon footprint is vital for sustainable business operations.
LinkedIn.com - Networking with a Conscience
LinkedIn, essential for professional networking, job searching, and business-related content sharing, requires 3 trees per 10,000 page views. As a platform used daily by professionals worldwide, LinkedIn's carbon footprint highlights the need for sustainable practices in digital networking.
Microsoft: Powering Business with Sustainability
Microsoft.com completes the top five, needing 3 trees per 10,000 page views. As a foundational platform for various business tools and services, Microsoft’s commitment to sustainability is crucial. The company's efforts to become carbon-negative by 2030 are steps in the right direction, but the current figures highlight the ongoing need for improvement.
Conclusion
The environmental impact of our digital world is profound and far-reaching. The data highlights the significant carbon emissions generated by some of the most popular platforms.
Whether it’s social media giants like Instagram and Facebook, essential business tools like Office and Zoom, or major e-commerce sites like Amazon and eBay, the carbon footprint of these digital services is substantial. It underscores the urgent need for these companies to adopt more sustainable practices and improve their energy efficiency.
The transition to renewable energy is not just a choice but a necessity. Companies that have yet to embrace sustainable energy sources.
As we continue to rely on digital platforms for work, entertainment, and communication, it's crucial that consumers and businesses alike, also advocate and support sustainable practices. By making conscious choices and supporting companies that prioritise the environment, we can collectively make a significant impact.
Matt Tutt, a digital marketing consultant who focuses on sustainable businesses said:
It's great that many people are taking note of the environmental impact of websites and the internet as a whole. We've probably all heard how the internet itself, if a country, would be the 4th largest emitter of CO2 in the world. Or how streaming an hour of content on Netflix emits approximately 55g CO2.
I think it's important for us to be aware of these "hidden costs" of having constant access to the internet, and for those who own a website it's a great place to start. We should be aware of how "dirty" our websites are, in terms of the type of energy used to power our web hosts (are they powered by renewables or not?), the resources needed to load the website on users devices, and the estimated carbon emissions generated from each visitor.
Huge carbon emission savings are there to be made by the brands out there that truly care about the environmental costs of running a business in today's always-connected world - and I'd argue that the larger the brand, the higher the impact will be.
A site that gets visited millions of times per day is going to be able to make the most impact in terms of emissions-savings, and looking at this table by Klatch its key that the Google-owned YouTube tries its best to clean its act up.
I think when big brands and sites take the topic of carbon emissions and environmental concerns seriously, and make real, meaningful changes, and are happy to share what they've done, and how, it will only have a positive knock-on effect on other brands out there.
To view the full study and raw data, click
here.